The graph below shows the approximate annual percentage growth rate in world population for the years 1960 through 2010. Data is estimated by the UN Census Bureau.Annual Growth Rate (Percentage)  Use the graph to answer the question.In which year during the period 1960-2010 is estimated world population the greatest?
A. 1970
B. 1963
C. 1960
D. 2010
Answer: D
You might also like to view...
Use the standard normal curve table to find the closest z-score for the given condition.30.2% of the total area is to the left of z.
A. -0.88 B. 0.52 C. -0.52 D. -0.53
Solve.On the morning of December 19 the temperature was -4°F. The next morning the temperature had risen 14°F. What was the temperature on the morning of December 20?
A. -10°F B. 18°F C. -18°F D. 10°F
Solve the problem.Find all values of a that will make the polynomial a perfect square trinomial. 4x2 + ax + 16
A. 8, -8 B. 16 C. 8 D. 16, -16
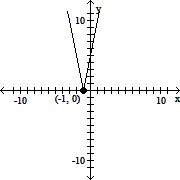
Determine the intervals on which the function is increasing, decreasing, and constant.
A. Increasing on (1, ?); Decreasing on (-?, 1) B. Increasing on (-?, -1); Decreasing on (-1, ?) C. Increasing on (-?, 1); Decreasing on (1, ?) D. Increasing on (-1, ?); Decreasing on (-?, -1)