The graph below indicates the number of new cases of Chalk Dust Disease (CDD) diagnosed each month in the Mathland. Let T(t) represent the total number of new cases per month, F(t) the number of new cases per month among algebraists, G(t) the number of new cases per month among geometers, and t the number of years since January 1, 1990.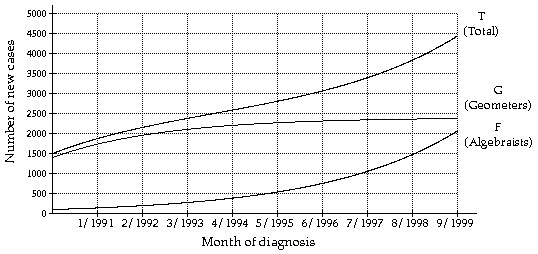 Estimate (T - F)(8) and interpret its meaning.
A. 3800; In January, 1998, there were about 3800 new cases of CDD diagnosed among geometers.
B. 1500; In January, 1998, there were about 1500 new cases of CDD diagnosed among algebraists.
C. 2400; In January, 1998, there were about 2400 new cases of CDD diagnosed among geometers.
D. 3800; In January, 1998, there were about 3800 new cases of CDD diagnosed.
Answer: C
Mathematics
You might also like to view...
Perform the indicated operations.0.43 - (-0.23)
A. 0.76 B. 0.2 C. 0.0989 D. 0.66
Mathematics
The Empirical Rule only applies to distributions that are
A. level B. in control C. normal D. standard
Mathematics
Simplify. Your answer should be in lowest terms.6 - 1
- 1 -
- 
A. 5
B. 4
C. 4
D. 5
Mathematics
Evaluate.(-7)3
A. 21 B. -21 C. 343 D. -343
Mathematics