Use the figure to answer the question.The average amount of weekend television viewing of high school students is shown below and used to create a frequency table. Frequency Distribution Table
 Which interval has the greatest amount of students?
A. 9-10
B. 5-6.5
C. 3-4.5
D. 7-8.5
Answer: D
Mathematics
You might also like to view...
Provide an appropriate response.The life (in hours) of light bulbs of a certain brand is normally distributed with mean 1000 and standard deviation 100. What percentage of such bulbs will burn more than 950 hours?
A. 65.54 B. 40.95 C. 69.15 D. 72.15 E. 68.34
Mathematics
Find the value of the expression.log31
A. 10 B. 3 C. 0 D. 1
Mathematics
Solve the problem.A stockbroker sold 65 shares of stock for $11.24 each. What was the total amount of the sale?
A. $730.71 B. $730.60 C. $730.7 D. $730.5
Mathematics
Use the graph of y =  to solve the equation
  where
where  and y2 represent linear functions.
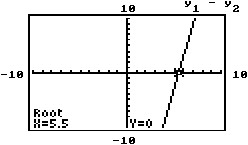
A. {6} B. {5.5} C. {5} D. {0}
Mathematics