The figure below shows a firm that has two plants. Plant 1 has a marginal cost curve of mc1, plant 2 has a marginal cost curve of mc2, and the overall marginal cost curve is MC. Managers maximize their profit by producing ________ units at plant 1 and ________ units at plant 2.
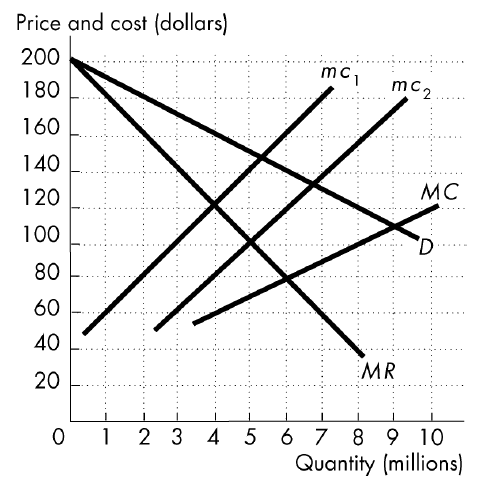
A) 2 million; 4 million
B) 0; 5 million
C) 4 million; 5 million
D) None of the above answers is correct.
A) 2 million; 4 million
You might also like to view...
How can an incomplete contract prevent opportunism? Explain with an example
 Refer to the above figure. If flow (1) is the cost businesses pay to the resource market, then:
A. (4) is the flow of goods and services. B. (6) is the flow of money income. C. (7) is the flow of revenue. D. (2) is the flow of productive resources.
When the price of a soft drink from the campus vending machine was $0.60 per can, 100 cans were sold each day. After the price increased to $0.75 per can, sales dropped to 85 cans per day. Over this range, the absolute price elasticity of demand for soft drinks was approximately equal to
A. 1.67. B. 0.73. C. 0.60. D. 0.15.
A player chooses a maximin strategy to ________ gain the player can earn.
A. maximize the maximum B. minimize the maximum C. maximize the minimum D. minimize the minimum