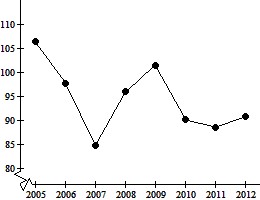
Construct the requested statistical display.The data below give the figures for the United States production of canned fruit from 2002 to 2009. Make a line graph for the data. 

 Year
Year
What will be an ideal response?

| Year |
You might also like to view...
Solve the problem. Round to the nearest hundredth.56 is 30% of what number?
A. 1866.70 B. 186.67 C. 16.80 D. 18.67
Answer the question according to what the textbook states.Which of these is the most important general tip for success in a mathematics course?
A. Do your homework B. Organize your class materials C. Don't be afraid to ask questions D. Check your work
Simplify.(8x6y4)2
A. 16x6y4 B. 64x12y8 C. 8x12y8 D. 8x8y6
A certain firm's marginal cost, in dollars, for a product is  , its marginal revenue, in dollars, is
  , and its total cost of production of 8 items is $900. Find the profit or loss at the
optimal level of production. Round your answer to the nearest dollar. ? A. $172 loss B. $172 profit C. $820 profit D. $820 loss E. $400 loss