Figure 9-3
?

In Figure 9-3, saving at equilibrium GDP is
A. $1,200 billion.
B. $1,000 billion.
C. $800 billion.
D. $600 billion.
E. $400 billion.
Answer: C
You might also like to view...
Grant has $200 to spend each month on restaurant meals and jazz performances at his
neighborhood jazz club. The price of a typical restaurant meal is $20 and the price of a jazz performance ticket is $10. Grant is maximizing his utility by consuming 6 restaurant meals and attending 8 jazz performances. Suppose Grant still has $200 to spend, but the price of restaurant meal rises to $25, while the price of jazz performance ticket drops to $8. Can it be determined if Grant is better off or worse off than he was before the price change? Use a budget constraint/indifference curve graph to illustrate your answer.
The total cost of producing one unit is $50. The total cost of producing two units is $75. At a production level of two units, the cost function exhibits
A) economies of scale. B) rising average costs. C) increasing marginal costs. D) constant returns to scale.
Refer to the figure below.________ inflation will eventually move the economy pictured in the diagram from short-run equilibrium at point ________ to long-run equilibrium at point ________, 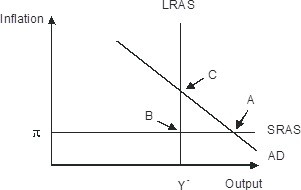
A. Rising; B; C B. Falling; A; C C. Falling; A; B D. Rising; A; C
Which of the following statements describes the situation for the United States at a real interest rate of 4 percent?
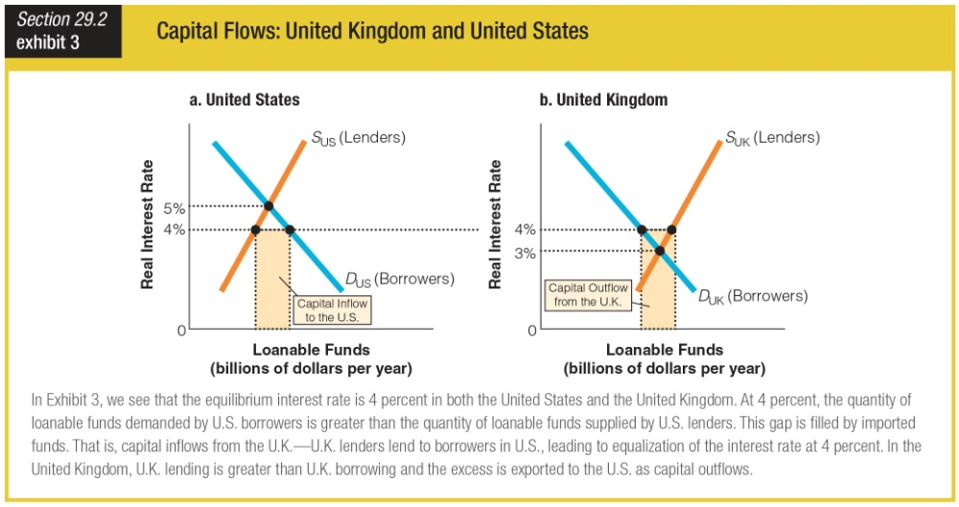
a. There is a capital inflow from the United States to the United Kingdom.
b. The interest rate is at the equilibrium level for the United States.
c. The quantity of loanable funds demanded by U.S. borrowers is greater than the quantity of loanable funds supplied by U.S. lenders.
d. The quantity of loanable funds demanded by U.K. borrowers is greater than the quantity of loanable funds supplied by U.K. lenders