In situations where you need to compare forecasting methods for different time periods, the most appropriate accuracy measure is
a. mean error
b. mean absolute error.
c. mean squared error.
d. mean absolute percentage error.
d
You might also like to view...
If bonds of $1,000,000 with unamortized discount of $10,000 are redeemed at 98, the gain on redemption of bonds is$10,000
a. True b. False Indicate whether the statement is true or false
Identify a correct statement about global diversity.
A. The French place high importance on team effort. B. Management-labor relations in France are more polarized than in the United States. C. Americans are the world's highest-paid employees. D. The Japanese prefer dealing with people who are outspoken.
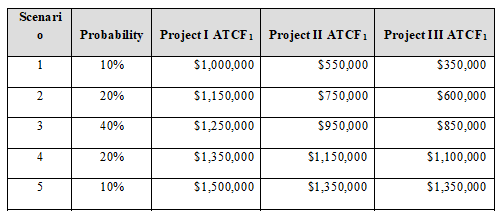
Powerful Wind, Inc. is a wind turbine manufacturer that is considering three investment projects: I, II, and III, that will cost $2,500,000, $2,300,000, and $3,700,000, respectively. The projects have an expected life of three, five, and seven years, correspondingly. The firm’s Vice President of Finance has estimated the probability distribution for each project’s first after-tax cash flow (ATCF1) as shown in the following table:
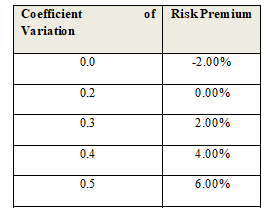
The Vice President of Finance uses the risk-adjusted discount technique to evaluate investment projects. He allocates risk premiums based on the coefficient of variation of each project’s after-tax cash flows according to the following table:
1. Each project’s after-tax cash flows are expected to grow at an annual rate of inflation of 3%.
a) Determine the expected cash flow, standard deviation, and coefficient of variation of each project in Year 1.
b) If the firm’s WACC is 15%, what is the appropriate risk-adjusted required rate of return of each project?
c) Using the appropriate discount rates, determine the payback period, discounted payback period, NPV, PI, IRR, and MIRR for each project.
d) If the projects are mutually exclusive, which project should be accepted? Answer the same question assuming they are independent projects.
6. Use the data of the previous problem to perform the following analysis:
a) Perform a sensitivity analysis using a Data Table. Determine the NPV, IRR, and PI as the ATCF1 takes on each possible outcome.
b) Determine the expected value and standard deviation of the NPVs, PI, and IRR of all projects.
c) Determine the coefficient of variation of the NPV, PI, and IRR of all projects.
d) Calculate the probability of a negative NPV, a PI less than one, and an IRR less than the required return for all projects.
e) Based on your results for parts (a), (b), (c), and (d), which project should be accepted?
Claymore Corp. has the following information about its standards and production activity for September. The controllable variance is: Actual total factory overhead incurred$28,175 Standard factory overhead: Variable overhead$3.10 per unit producedFixed overhead ($12,000/6,000 estimated units to be produced)$2 per unitActual units produced 4,800 units
A. $1,295U. B. $2,400F. C. $1,295F. D. $2,400U. E. $3,695U.