A supply schedule
A) is a table that shows the relationship between the price of a product and the quantity of the product supplied.
B) is a curve that shows the relationship between the price of a product and the quantity of the product supplied.
C) is the relationship between the supply of a product and the cost of producing the product.
D) is a table that shows the relationship between the price of a product and the quantity of the product that producers and consumers are willing to exchange.
Answer: A
You might also like to view...
Refer to the figure below.________ inflation will eventually move the economy pictured in the diagram from short-run equilibrium at point ________ to long-run equilibrium at point ________. 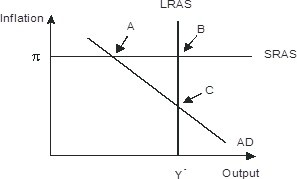
A. Rising; A B. Falling; A; C C. Falling; B: C D. Rising; A; C
Starting from long-run equilibrium, a sharp drop in oil prices results in ________ output in the short run and ________ output in the long run.
A. lower; higher B. lower; potential C. higher; higher D. higher; potential
If the average cost of transporting a passenger on the train from Chicago to St. Louis is $75, it would be irrational for the railroad to allow any passenger to ride for less than $75
a. True b. False Indicate whether the statement is true or false
In October 2008, __________ percent of the unemployed workers in the United States were collecting unemployment benefits.
A. 32 B. 38 C. 46 D. 64