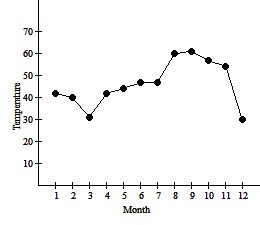
Solve the problem.The data in the table show the average daily low temperatures recorded in a certain city last year. Make a time series graph of these data.
What will be an ideal response?
Mathematics
You might also like to view...
Show that the functions f and g are identically equal.f(x) = csc x ? sec x, g(x) = cot x + tan x
What will be an ideal response?
Mathematics
Translate to a proportion and solve. 36.5% of 3800 is what?
A. 2433 B. 1900 C. 2413 D. 1387
Mathematics
Write the fraction as a terminating or repeating decimal.
A. 0.4 B. 0.28 C. 0.54 D. 0.48
Mathematics
Find the slope and the y-intercept of the given line.y = -4x + 7
A. -4, (0, -7) B. 7, (0, -4) C. -7, (0, -4) D. -4, (0, 7)
Mathematics