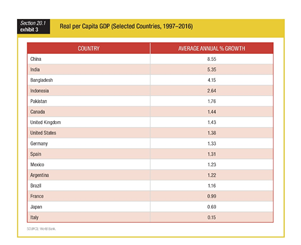
Explain the impact that growth rates have on countries, both rich and poor, over time. Select three countries from Exhibit 3 and calculate to a tenth of a year how many years it will take their economies to double, assuming their growth rates remain constant.
What will be an ideal response?
but students should demonstrate an understanding of how economic growth rates will result in some countries become richer than others over time and may even result in today’s richest countries losing their place at the top due to relatively low growth rates. The economies listed in Exhibit 3 will double as follows: China, 8.2 years; India, 13.1; Bangladesh, 16.9; Indonesia, 26.5; Pakistan, 39.8; Canada, 48.6; United Kingdom, 49; United States, 50.7; Germany, 52.6; Spain, 53.4; Mexico, 56.9; Argentina, 57.4; Brazil, 60.3; France, 70.7; Japan, 101.4; Italy, 466.7.
You might also like to view...
In Figure 13.1, "the zero lower bound" is displayed at ________
A) point 1 B) point 2 C) D) the origin (intersection of the axes) E) none of the above
The purpose of an effluent fee is to
A) reduce the amount produced of a good and to raise the market price. B) correct for pollution while keeping the price of the good the same as before the correction. C) reward people producing externalities. D) encourage producers to keep the quantity produced the same while lowering the price.
A price discriminating monopsonist could increase its profits by
a. paying the minimum wages possible. b. hiring as little capital as possible. c. paying lower wages to workers with inelastic supply of labor curves than to workers with elastic curves. d. paying lower wages to workers with elastic supply of labor curves than to workers with inelastic curves.
According to the theory of rational expectations, the economy always remains at the natural rate of unemployment, irrespective of policy changes
a. True b. False Indicate whether the statement is true or false