Which of the following corresponds to the following line plot?
Number of Laps Run x x x x x
x x x x x x x x x
x x x x x x x x x
?
0 1 2 3 4 5 6 7 8 9 10 11 12 13 14 15
?
A. ?
| Data Values | Frequency |
| 0 | 3 |
| 1 | 2 |
| 5 | 2 |
| 6 | 3 |
| 9 | 3 |
| 12 | 3 |
| 13 | 3 |
| 14 | 3 |
| 15 | 2 |
B. ?The distribution is bimodal.
C. ?The distribution is skewed right.
D. ?There are a total of 22 runners who ran anywhere from 0 to 15 laps.
E. ?
| Data Values | Frequency |
| 0 | 3 |
| 1 | 2 |
| 5 | 2 |
| 6 | 3 |
| 10 | 3 |
| 12 | 3 |
| 13 | 2 |
| 14 | 3 |
| 15 | 2 |
Answer: E
You might also like to view...
Given the set sketched on the number line, identify the type of interval (open, closed, half-open, open infinite, closed infinite), write the set using set-builder notation, and write the set using interval notation.![]()
A. open infinite interval; {x|x > 1}; (1, ?) B. closed infinite interval; {x|x ? 1}; [1, ?) C. closed infinite interval; {x|x ? 1}; (-?, 1] D. open infinite interval; {x|x < 1}; (-?, 1)
Determine whether the graph is the graph of a function.
A. No B. Yes
Graph the rational function.f(x) = 

A. 
B. 
C. 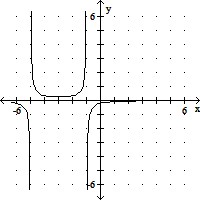
D. 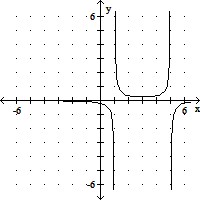
Let U = {all soda pops}; A = {all diet soda pops}; 
 and
and  Describe the given set in words.A ? D
A. All caffeine-free diet soda pops B. All diet cola soda pops C. All soda pops that are diet or caffeine-free soda pops D. All soda pops that are diet or caffeinated soda pops