Using Figure 1 above, if the aggregate demand curve shifts from AD2 to AD3 the result in the short run would be: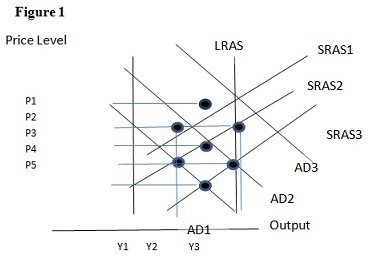
A. P1 and Y2.
B. P2 and Y3.
C. P3 and Y1.
D. P2 and Y2.
Answer: B
You might also like to view...
Refer to the above figure. The figure represents the consumption function for a consumer. Point D represents
A) autonomous consumption. B) saving. C) dissaving. D) zero saving.
An empirical study determines that price exceeds marginal cost at the levels of output of firms in long-run equilibrium in the widget industry. The widget industry may therefore
A. be monopolistically competitive. B. have firms whose goal is sales maximization. C. have firms that act as price leaders. D. All of the responses are correct.
Each C + I + G + (X ? IM) expenditure schedule is drawn assuming a specific
A. income level. B. spending level. C. production level. D. price level.
For an increase in demand, the price effect is smallest and the quantity effect is largest:
A. when supply is least elastic. B. in the long run. C. in the short run. D. in the immediate market period.