Refer to the information provided in Figure 5.7 below to answer the question(s) that follow.
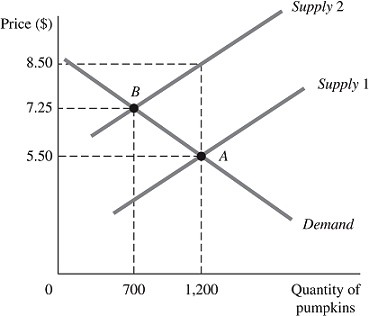 Figure 5.7The above figure represents the market for pumpkins both before and after the imposition of an excise tax, which is represented by the shift of the supply curve.Refer to Figure 5.7. After the tax, store owners are willing to sell ________ pumpkins at a price of ________ each.
A. 0; $8.50
B. 1,200; $5.50
C. 1,200; $7.25
D. 700; $7.25
Answer: D
You might also like to view...
There are very few, if any, farms within the city limits of Chicago because
A) zoning laws have always prohibited them. B) the land under the city of Chicago is unfertile. C) Chicago is known for its butchers and freighters, not its farmers. D) the land is in extremely great demand for non-agricultural purposes.
Monopsony power is akin to an age-old proposition in economics that scarcity brings power, except in this case power is due to
a. scarce resources b. scarce input purchases c. scarce suppliers d. scarce purchasing time e. scarce product market
Which is the most accurate statement?
A. The poverty of older Americans is much greater than the problem of child poverty. B. Public assistance has been considered a great success. C. Medicare and Medicaid date back to the New Deal of the 1930s. D. Less than half of those eligible receive food stamps.
If interest rates rose more in Japan than in the U.S., then other things the same
a. U.S. citizens would buy more Japanese bonds and Japanese citizens would buy more U.S. bonds. b. U.S. citizens would buy more Japanese bonds and Japanese citizens would buy fewer U.S. bonds. c. U.S. citizens would buy fewer Japanese bonds and Japanese citizens would buy more U.S. bonds. d. U.S. citizens would buy fewer Japanese bonds and Japanese citizens would buy fewer U.S. bonds.