A demand curve is a
A) graphical representation of the demand schedule.
B) graphical representation of alternative demands.
C) horizontal line connecting amounts demanded at various income levels.
D) graphical relationship, that includes several things such as tastes, time, and supply.
Answer: A
You might also like to view...
Refer to the figure below. What might cause a shift from the original demand curve to the new demand curve? 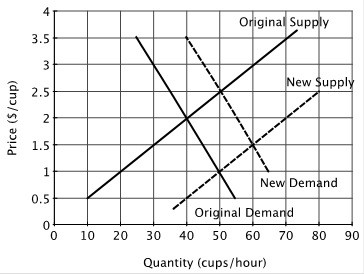
A. A decrease in the price of tea. B. An increase in the price of coffee creamer. C. An expectation that coffee prices will fall in the future. D. An increase in consumers' tastes for coffee.
Refer to Figure 9.3. If the government establishes a price ceiling of $1.00, total consumer and producer surplus will be
A) $1.50. B) $300. C) $450. D) $500. E) $600.
At various times, the United States has undergone the painful process of reducing military spending. Military bases from the Carolinas to California pleaded to be spared, citing huge job losses if they close. How can one rationally decide which bases to shut down, given the necessity of jobs?
Jim buys a $1000 bond from ABC Company. ABC Company uses the $1000 to purchase a new piece of machinery. Whose spending would be an act of investment in the language of macroeconomics?
a. only Jim's b. only ABC Corporation's c. Jim's and ABC Corporation's d. neither Jim's nor ABC Corporation's