What can you conclude by comparing the left and right hydrographs, each of which depict the same amount of time?
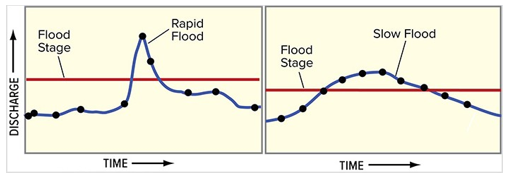
A) The left diagram has a higher peak discharge.
B) The right diagram represents a quicker event, like a flash flood.
C) Neither graph shows a true flood.
D) None of these are correct.
A) The left diagram has a higher peak discharge.
You might also like to view...
Labeling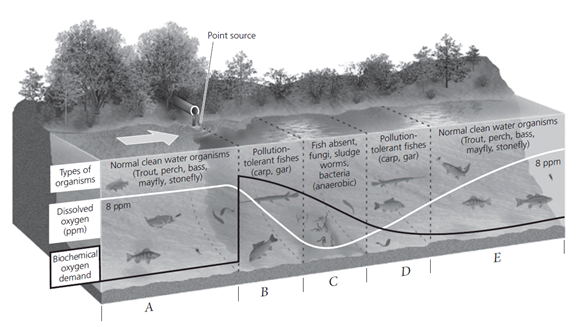
A. B. In the accompanying oxygen sag curve, choose the zone in which the breakdown of degradable wastes by bacteria starts to deplete the dissolved oxygen. C. In the accompanying oxygen sag curve, choose the zone in which population of organisms with high oxygen requirements will most likely be eliminated.
If both limbs of a fold dip in the same direction, the fold is ____________________. Fill in the blank(s) with the appropriate word(s)
The ________ the tilt of the earth, the smaller the temperature difference between summer and winter
Fill in the blank(s) with correct word
The bed load of a stream moves at average rates of meters/day to several kilometers/day in most streams
Indicate whether the statement is true or false