Solve the problem.The following table shows the number of fires in a county for the years 1994-1998, where 1 represents 1994, 2 represents 1995, and so on.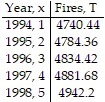 This data can be approximated using the third-degree polynomial T(x) = -0.49x3 + 0.51x2 + 58.82x + 4681.6.Use the Leading Coefficient Test to determine the end behavior to the right for the graph of T. Will this function be useful in modeling the number of fires over an extended period of time? Explain your answer.
A. The graph of T approaches zero for large values of x. This means that T will not be useful in modeling the number of fires over an extended period.
B. The graph of T decreases without bound to the right. This means that as x increases, the values of T will become more and more negative and the function will no longer model the number of fires.
C. The graph of T increases without bound to the right. This means that as x increases, the values of T will become large and positive and, since the values of T will become so large, the function will no longer model the number of fires.
D. The graph of T decreases without bound to the right. Since the number of larceny thefts will eventually decrease, the function T will be useful in modeling the number of fires over an extended period of time.
Answer: B
You might also like to view...
Solve the problem.The driver of a car traveling at 54 ft/sec suddenly applies the brakes. The position of the car is  t seconds after the driver applies the brakes. How far does the car go before coming to a stop?
A. 972 ft B. 9 ft C. 243 ft D. 486 ft
Solve the exponential equation.
?
 ?
?
A. 
B. 
C. 
D. 
E. 
Use the fundamental counting principle to count the number of outcomes. A salesman packed 3 shirts and 5 ties. With one shirt, he could wear all 5 ties. With another shirt, he could wear 4 ties. With the third shirt, he could wear only 2 ties. How many different combinations did he have?
A. 11 B. 22 C. 10 D. 40
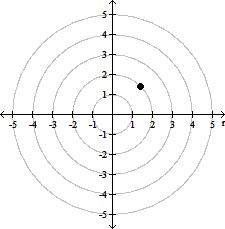
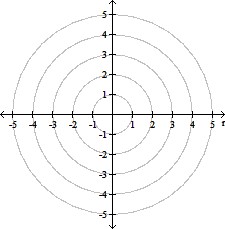
Plot the point given in polar coordinates.
A. 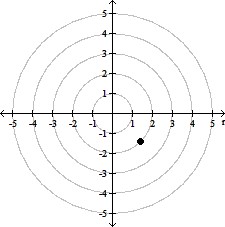
B. 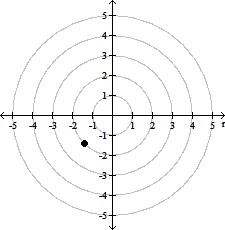
C. 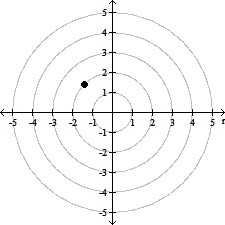
D.