Refer to the graph shown. 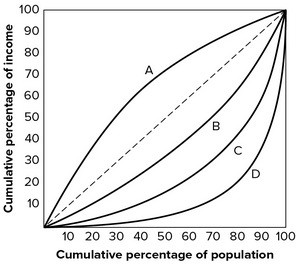 The Lorenz curve showing the most income inequality is
A. A.
B. B.
C. C.
D. D.
Answer: D
You might also like to view...
Assume a firm is operating under conditions of pure competition and faces a marginal cost function that is everywhere below its average total cost
If the firm is producing where marginal revenue equals marginal cost will it be possible for it to make an economic profit? Explain.
The price elasticity of supply is equal to
A) the change in quantity supplied divided by the change in price. B) the percentage change in quantity supplied divided by the percentage change in price. C) the value of the slope of the supply curve. D) the percentage change in price divided by the percentage change in quantity supplied.
The distribution of income is not a zero-sum game
Indicate whether the statement is true or false
A long-run ATC curve shows:
A. the minimum average total cost possible for every possible size firm across an industry. B. which size firm can capture the lowest costs per unit for an industry. C. what size firms can capture economies of scale by expanding. D. All of these are true.