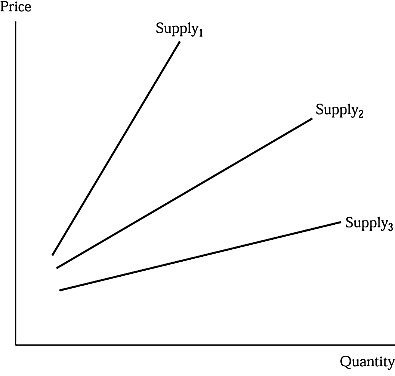
 In Figure 4.3, the most elastic supply curve:
A. is Supply1.
B. is Supply2.
C. is Supply3.
D. cannot be determined.
Answer: C
You might also like to view...
Refer to the figure above. Which of the following statements are true in this case?
A) P1 is the socially optimal price for Good X. B) P2 is the price of Good X in a free market. C) Q2 is the efficient level of output of Good X. D) Q2 is the quantity supplied of Good X in a free market.
Trade between countries tends to a. reduce both competition and specialization
b. reduce competition and increase specialization. c. increase competition and reduce specialization. d. increase both competition and specialization.
All of the following would affect the position of a country's production possibilities curve, except:
A. technological progress. B. the amount of the capital stock. C. the quantity of labor. D. the level of unemployment.
Answer the question on the basis of the following information. Suppose the members of population A, consisting of Al, Bob, Curt, Doris, and Ellie, receive annual incomes of $5,000, $2,500, $1,250, $750, and $500, respectively. Refer to the given
information and this information as well. The members of population B, consisting of Fred, George, Holly, Irma, and Joan, receive incomes of $4,000, $3,000, $1,250, $950, and $800, respectively. We: A. can say that the income of population B is less equally distributed than that of population A. B. can say that the income of population B is more equally distributed than that of population A. C. cannot make a meaningful comparison of the income distributions of populations A and B. D. can say that the poorest quintile of population B receives 12 percent of total income.