The graph of the logarithm is
?
A. Decreasing and concave down.
B. Decreasing and concave up.
C. Increasing and concave up.
D. Increasing and concave down.
Answer: D
You might also like to view...
Use the 68-95-99.7 rule to solve the problem.For women at Hartford College, times to run 400 meters are normally distributed with a mean of 85 seconds and a standard deviation of 7 seconds. What percentage of the times are more than 71 seconds?
A. 2.5% B. 95% C. 5% D. 97.5%
Solve the triangle. 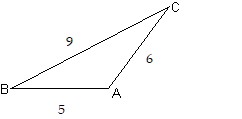
A. A = 109.5°, B = 38.9°, C = 31.6° B. A = 38.9°, B = 31.6°, C = 109.5° C. A = 109.5°, B = 31.6°, C = 38.9° D. A = 38.9°, B = 109.5°, C = 31.6°
Write true or false for the statement.1 centimeter = 0.01 meter
A. True B. False
Draw a tree diagram to find the number of possible outcomes.Toss two six-sided dice.
A. 1 outcome B. 36 outcomes C. 12 outcomes D. 2 outcomes