Use the accompanying graph of y = f(x) to sketch the graph of the indicated function. Label at least three points on the new graph.y = 2f(x)


A. 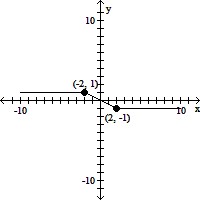
B. 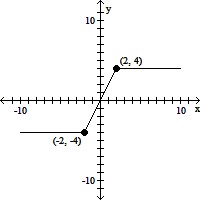
C. 
D. 
Answer: D
Mathematics
You might also like to view...
Graph the inequality.y ? 7 
A. 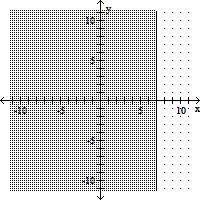
B. 
C. 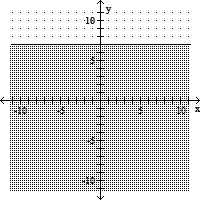
D. 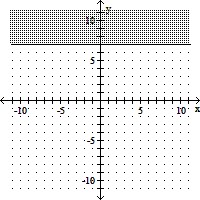
Mathematics
You are given a table showing input and output values for a given function y1 = f(x). Use the table to answer the question.What is the y-intercept of the graph of y = f(x)?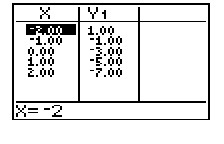
A. 3 B. 0 C. -3 D. 1
Mathematics
The graph of  is given in the figure. State whether
  or
or 
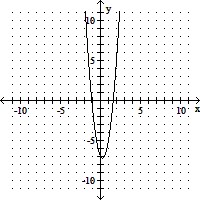
A. a > 0 B. a < 0
Mathematics
Perform the indicated operation.v = 3i + 4j + 2k and w = -2i - 6j - 5kFind  -
-  .
.
A.  -
- 
B.  -
- 
C. 
D. 
Mathematics