Use the figure below to answer the following question. 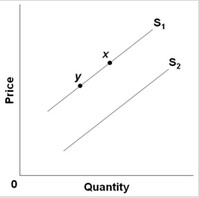 An increase in quantity supplied is depicted by a
A. move from point y to point x.
B. shift from S1 to S2.
C. move from point x to point y.
D. shift from S2 to S1.
Answer: A
You might also like to view...
Tom's marginal utility from a Sobe exceeds his marginal utility of crackers. Therefore, his total utility of Sobe must exceed his total utility of crackers
Indicate whether the statement is true or false
If the money supply is $1,000 . the price level is 3, and real income (or output) is $5,000 . then the velocity of money is _____
a. 0.2 b. 0.6 c. 1.67 d. 5 e. 15
When an increase (decrease) in the price of one good causes a decrease (increase) in the demand for another good, the two goods are called ______.
a. complements b. detriments c. tributes d. substitutes
Poorer countries started to develop economically when they
A. focused on domestic economic regulation. B. focused on becoming net traders. C. focused on becoming importers. D. figured out what the rest of the world wanted, and responded.