Which of the following is NOT an example of a way in which microeconomic analysis can help in designing environmental policy?
A. Examining the trade-offs between ecological benefits of environmental legislation and its impacts on consumers' standard of living
B. Lobbying consumers and firms to reduce consumption of energy
C. Designing laws to provide incentives for firms to implement clean technologies in new vehicles
D. Determining the optimal level of vehicle fuel efficiency standards
B. Lobbying consumers and firms to reduce consumption of energy
You might also like to view...
Which of the following best represents negotiation costs?
A) Dinesh has to spend time and effort to make sure that the chemical factory is living up to the agreed upon bargain that it will reduce the pollution it is releasing into the local river by 50 percent. B) Laila needs to come up with enough cash to pay the owners of the paper manufacturing plant, its attorneys, accountants, and negotiators so that a bargain can be reached with the paper manufacturer to reduce air pollution. C) Esperanza has to spend time and effort locating and organizing all the other people who have been adversely affected by the strong odors emanating from the local slaughterhouse in order to initiate the bargaining process. D) Rafael has to spend time determining whether the fertilizer manufacturer, the lead smelter, or the oil refinery is the cause of pollution seeping into the groundwater in his local community.
If stocks are more risky than bonds, why would a rational investor ever buy stocks?
A clear conclusion from offshoring debates and analyses is that:
a. It has significant potential to redistribute income from labor to businesses. b. Its effect is to increase unemployment in the nation from which offshoring takes. c. Its effect is always to decrease GDP in the nation from which offshoring takes. d. All of the above are clear conclusions from these debates and analyses.
The following is budget information for a hypothetical economy. All data are in billions of dollars.
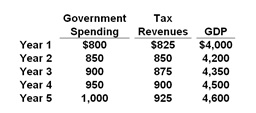
Refer to the above table. In which year is there a balanced budget?
A. Year 1
B. Year 2
C. Year 3
D. Year 4