Solve the problem involving modeling with polynomial functions. 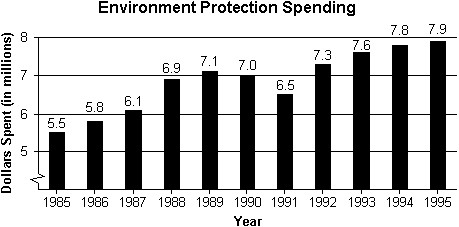 The bar graph shows the number of dollars spent in Country X (in millions) on environmental protection programs during the years 1985 (x = 1), through 1995
  . A graphing calculator was used to find the polynomial functions that best fit these data.(quadratic) y ? -0.010x2 + 0.346x + 5.253(cubic) y ? 0.005x3 - 0.102x2 + 0.805x + 4.697(quartic) y ? -3.497 × 10-4x4 + 0.013x3 - 0.169x2 + 1.00x + 4.53Use these three functions to predict the
school enrollment for 1996. Compare the results to the actual value of $8.3 million.
A. The quadratic function gives 7.833, the cubic function gives 7.511, and the quartic function gives 8.407. The quartic function is the best predictor in this case.
B. The quadratic function gives 7.407, the cubic function gives 7.965, and the quartic function gives 8.309. The quartic function is the best predictor in this case.
C. The quadratic function gives 7.965, the cubic function gives 8.309, and the quartic function gives 7.407. The cubic function is the best predictor in this case.
D. The quadratic function gives 8.407, the cubic function gives 7.833, and the quartic function gives 7.511. The quadratic function is the best predictor in this case.
Answer: C
You might also like to view...
Find the product.(7a + 8c)(7a - 8c)
A. 49a2 - 112ac - 64c2 B. 49a2 - 64c2 C. 7a2 - 8c2 D. 49a2 + 112ac - 64c2
Find the area of the rectangle or square.
![]() 17 in.
17 in.
A. 119 square inches B. 1734 square inches C. 1445 square inches D. 1724 square inches
Use the vertical line test to determine if the graph is a function.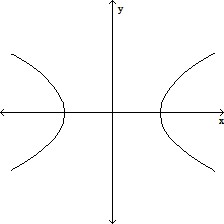
A. Yes B. No
Find a rectangular equation for the plane curve defined by the parametric equations.x = 3t, y = t + 7, for t in (-?, ?)
A. y =  + 7
+ 7
B. y = 3x - 7
C. y = 3x + 7
D. y =  - 7
- 7