The Laffer Curve demonstrates that _____
a. at some level of tax rates, tax revenues decline
b. there is no relationship between tax rates and tax revenue
c. there is no relationship between tax rates and labor supply
d. at some level of tax rates, labor supply declines
a
You might also like to view...
Use the figure below to answer the following question.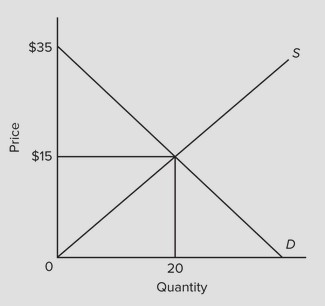 At equilibrium, producer surplus is
A. 300. B. 150. C. 200. D. 400.
George has a $600 annual entertainment budget that he uses to buy trips to the movies and dinners at local restaurants. The figure above shows indifference curves and budget lines for these two goods. The price of a movie is $15
a) Along budget line BL1, what is the price of a dinner? b) What combination of dinners and movies will George select along budget line BL1? c) Budget line BL2 represents a change in the price of dinners from that along BL1. What is the new price of dinners along this budget line? d) What combination of dinners and movies will George select along budget line BL2? e) Use the information in this problem to give two points on George's demand curve for dinners.
Equivalent variation means
A. finding an equivalent change in income that puts a person on the same utility as a change in price would. B. finding equal tax rates that insure quantity demanded does not change. C. equalizing excess burden across all markets. D. moving the same distance in either direction from a starting point on an indifference curve.
Which of the following countries has the largest union membership measured as the percentage of civilian employees in unions?
a. The United States b. The United Kingdom c. Sweden d. Japan