Refer to the information provided in Figure 5.7 below to answer the question(s) that follow.
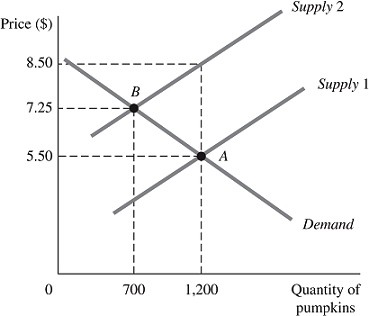 Figure 5.7The above figure represents the market for pumpkins both before and after the imposition of an excise tax, which is represented by the shift of the supply curve.Refer to Figure 5.7. The total revenue the government will receive from the imposition of this tax is
A. $875.
B. $1,225.
C. $2,100.
D. $3,600.
Answer: C
You might also like to view...
In the advanced economies, ________ of the factories use advanced capital equipment, and in the developing economies, ________ of the factories use advanced capital equipment
A) virtually all; virtually all B) some; some C) virtually all; none D) some; none of E) virtually all; some
A market demand curve can be constructed by
A) adding the prices all consumers will pay for any given quantity. B) adding the quantities that all consumers buy at each price. C) adding the quantities that a consumer buys at the highest price. D) None of the above answers is correct.
Keynesians believe in
a. active management of structural deficits an minimal cyclical deficits. b. running structural budget deficits to stimulate output c. running large surpluses during expansions. d. active management of cyclical deficits and minimal structural deficits. e. both c and d.
A market is said to be concentrated when:
a. the degree of competition in the market increases. b. many firms supply to a small number of consumers. c. the firms producing identical goods are clustered in a particular location. d. a firm or a few firms are able to dictate the competitive conditions in a market. e. there is a huge immigration of workers from neighboring areas.