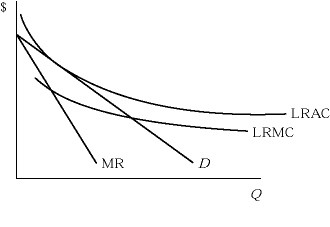
 Figure 8.6 depicts a monopolistically competitive firm in the long run. Illustrate on the graph the firm's price and output level in long-run equilibrium. Explain.
What will be an ideal response?
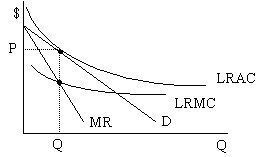
As illustrated on the graph, the firm picks the quantity at which its marginal revenue equals its marginal cost, shown as Q (this is the level of output at which the MR and LRMC curves intersect). It will charge price P for that level of output; P is the price associated with Q on the demand curve facing the firm.
You might also like to view...
According to the text, much of the increase in productivity that has occurred more recently in the fast food industry was the result of improvements in capital and technology
Indicate whether the statement is true or false
According to Figure 6.1, the period from 1996 to 2011 is particularly remarkable for the rapid growth of ________
A) productivity B) labor input C) output D) capital input
Under flexible exchange rates, the exchange rate is set by
A) the International Monetary Fund. B) the U.S. Federal Reserve's Board of Governors. C) the intersection of demand and supply curves in the currency markets. D) negotiations among central banks of the major industrial powers.
Contractionary monetary policy causes:
a. Aggregate demand to rise, prices to rise, and real GDP to fall. b. Aggregate demand to rise, prices to rise, and real GDP to rise. c. Aggregate demand to fall, prices to fall, and real GDP to fall. d. Aggregate supply to rise, prices to rise, and real GDP to rise. e. Aggregate supply to rise, prices to rise, and real GDP to fall.