Solve the problem.This chart shows the number of meals served in a restaurant during each of the past 4 months. Assume that the information in the chart defines a function with the name g. Find g(March). 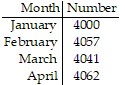
A. 4000 meals
B. 4041 meals
C. 4057 meals
D. 4062 meals
Answer: B
You might also like to view...
Simplify the radical expression. Assume that all variables represent positive real numbers.
A. -x B. x C. 0 D. Is not defined
For the pair of supply and demand equations, where x represents the quantity demanded in thousands of units and p the unit price in dollars, find the equilibrium quantity and the equilibrium price.
?
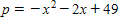 and
and 
?
A. xb = 3,000 units pb = $45
B. xb = 2,000 units pb = $41
C. xb = 3,000 units pb = $44
D. xb = 2,500 units pb = $41
E. xb = 2,000 units pb = $45
Find the coordinates of the vertex for the parabola defined by the given quadratic function.f(x) = 11(x - 5)2 + 9
A. (5, 9) B. (11, 5) C. (9, -5) D. (-5, 9)
Write the polynomial in descending powers of the variable with no missing powers.6x3 + 8x5 - 7x - 8
A. 6x3 + 8x5 + 0x2 - 7x - 8 + 0x4 B. 7x9 - 8 C. 8x5 + 6x3 - 7x - 8 D. 8x5 + 0x4 + 6x3 + 0x2 - 7x - 8