Refer to the graph above. When output increases from Q 1 and the price level decreases from P 1, this change will:
Be caused by a shift in the aggregate supply curve from AS1 to AS2
Result in a movement along the aggregate demand curve from e3 to e1
Result in a movement along the aggregate demand curve from e1 to e2
Be caused by a shift in the aggregate supply curve from AS1 to AS3
Be caused by a shift in the aggregate supply curve from AS1 to AS3
You might also like to view...
"Income elasticity of demand is always positive." Do you agree or disagree? Explain
What will be an ideal response?
If we measure the income elasticity of a good as ?1.8, this means this good is a(n):
a. luxury good. b. substitute good. c. complementary good. d. inferior good. e. good from the food group.
Which of the following changes best represents the effect of the oil embargo (a shut-off of oil from certain OPEC countries) of the 1970s on the U.S. economy?
What will be an ideal response?
Refer to the information provided in Figure 9.7 below to answer the question(s) that follow. 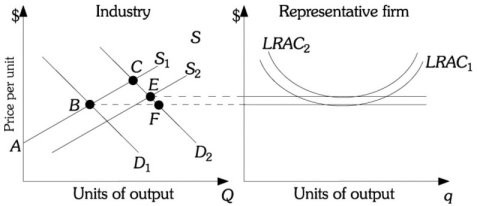 Figure 9.7 Refer to Figure 9.7. The type of industry depicted in this situation is
A. an increasing-cost industry. B. a constant-cost industry. C. a decreasing-cost industry. D. impossible to determine from this information.