Graphical Analysis: The graph in the figure represents the velocity of a particle as it travels along the x-axis. What is the average acceleration of the particle between t = 2.0 s and t = 4.0 s?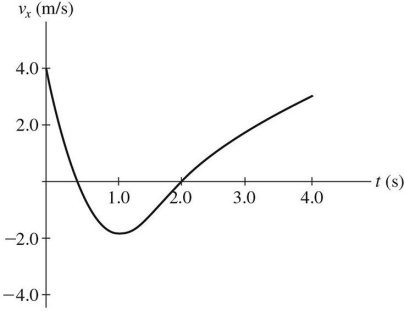
Fill in the blank(s) with the appropriate word(s).
1.5 m/s2
Physics & Space Science
You might also like to view...
In a tetragonal unit cell, a=b but c is not equivalent. Which plane is therefore not equivalent?
(a) (100) (b) (010) (c) (010) (d) (001)
Physics & Space Science
Above is an image of a supergranule

a. True
b. False
Physics & Space Science
Light of wavelength 575 nm passes through a double-slit and the third order bright fringe is seen at an angle of 6.5° away from the central fringe. What is the separation between the double slits?
A) 5.0 µm B) 10 µm C) 15 µm D) 20 µm E) 25 µm
Physics & Space Science
What is the radius of curvature of the path of a 3.0-keV proton in a perpendicular magnetic field of magnitude 0.80 T?
a. 9.9 mm b. 1.1 cm c. 1.3 cm d. 1.4 cm e. 7.6 mm
Physics & Space Science