Refer to the graphs below. Which graph shows an increase in the price of X and a decrease in the price of Y?
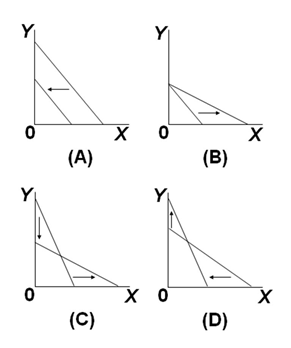
A. Graph A
B. Graph B
C. Graph C
D. Graph D
D. Graph D
You might also like to view...
Refer to above figure. Assume that Boeing is the first to enter the Hungarian market. Without a government subsidy what price would they demand, and what would be their total profits?
What will be an ideal response?
Suppose a bank has assets of $500 million and capital of $100 million. Its return on assets is -3%. What is its leverage ratio? What is its return on equity?
What will be an ideal response?
When aggregate expenditure increases, why is there a multiple expansion of income and real GDP? Trace the multiplier effect through the first four rounds when there is an increase in aggregate expenditure of $40 billion and the marginal propensity to consume is 0.75
Is the actual amount of output that corresponds to the long-run aggregate supply curve fixed? Explain.
What will be an ideal response?