Refer to the information provided in Figure 3.11 below to answer the following question(s).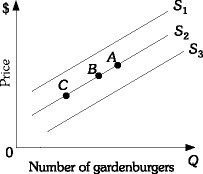 Figure 3.11Refer to Figure 3.11. A decrease in supply is represented by the movement from
A. Point B to Point C along supply curve S2.
B. Point B to Point A along supply curve S2.
C. S2 to S1.
D. S2 to S3.
Answer: C
You might also like to view...
If the Fed wants to increase the interest rate, it will
a. buy bonds and increase the money supply. b. buy bonds and decrease the money supply. c. sell bonds and increase the money supply. d. sell bonds and decrease the money supply. e. sell bonds and increase money demand.
If we sum the private marginal cost curves of firms producing nuclear power, we create the
a. industry supply curve for nuclear power b. market equilibrium for nuclear power c. total value of the negative externalities generated by nuclear power d. optimal allocation of resources associated with nuclear power e. marginal externality cost curve for nuclear power
If the Fed reduces the required reserve ratio,
a. excess reserves will increase. b. excess reserves will decrease. c. total reserves will increase. d. total reserves will decrease.
Which of the following best explains why high marginal tax rates retard output?
a. High marginal tax rates reduce the incentive to earn, invest, and use resources efficiently. b. High marginal tax rates will encourage foreign investment. c. High marginal tax rates will reduce budget deficits and lower interest rates. d. High marginal tax rates encourage people to substitute more-desired nondeductible goods for less-desired tax-deductible goods.