An objective function and a system of linear inequalities representing constraints are given. Graph the system of inequalities representing the constraints. Find the value of the objective function at each corner of the graphed region. Use these values to determine the maximum value of the objective function and the values of x and y for which the maximum occurs.Objective Function z = 7x + 6yConstraints x ? 0 y ? 0 3x + y ? 21 x + y ? 10 x + 2y ? 12
A. Maximum 60; at (6, 3)
B. Maximum 65.5; at (5.5, 4.5)
C. Maximum 66; at (6, 4)
D. Maximum 68; at (8, 2)
Answer: B
Mathematics
You might also like to view...
Add.32,113 + 23,342
A. 55,545 B. 55,455 C. 55,547 D. 64,455
Mathematics
Solve the problem.The costs of a hurricane in Kate's home state were $2.80 million. The costs of a hurricane in Jorg's home state were $5.75 million. How much more were the costs of the hurricane in Jorg's home state?
A. $3.95 million B. $4 million C. $2.85 million D. $2.95 million
Mathematics
Multiply.(10p - 1)(100p2 + 10p + 1)
A. 1000p3 - 1 B. 1000p3 + 110p2 - 1 C. 1000p3 + 1 D. 100p3 - 1
Mathematics
Graph the function by starting with the graph of the basic function and then using the techniques of shifting, compressing, stretching, and/or reflecting.f(x) = (x + 2)2 - 4
A. 
B. 
C. 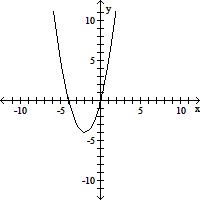
D. 
Mathematics