By looking at the graph showing the poverty rate from 1959 to 2016, you can see that ______.
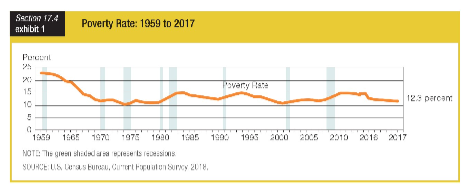
a. 2016 has the highest rate on record
b. rates have risen steadily since 1959
c. the overall rate is much lower than it was in 1959
d. rates were increasing rapidly in 2016
c. the overall rate is much lower than it was in 1959
You might also like to view...
Which of the following statements is inconsistent with an elastic demand curve?
A. The relative change in quantity exceeds the relative change in price. B. Total revenues fall when prices rise. C. Buyers are relatively sensitive to price changes. D. The absolute value of the price elasticity of demand is less than 1.
Angelina, age seven, decides to dress up like Princess Fiona for Halloween. What is the opportunity cost of her decision?
A) the cost of the costume B) zero, because seven-year-olds don't have opportunity costs C) the fact that she can't dress up like Dora the Explorer, her second choice D) the cost of the Lady Gaga costume which she did not want
Which of the following allows us to compare average levels of real production per person in different nations in a way that adjusts for differences in true costs of living?
A. per capita nominal GDP based on foreign exchange rates B. nominal GDP based on purchasing power parity C. per capita real GDP based on purchasing power parity D. real GDP based on foreign exchange rates
Specialization and trade allow a country to
A. produce on its production possibility frontier and consume outside it. B. produce and consume on its production possibility frontier. C. produce and consume inside its production possibility frontier. D. produce and consume outside its production possibility frontier.