Refer to the information provided in Figure 2.5 below to answer the question(s) that follow.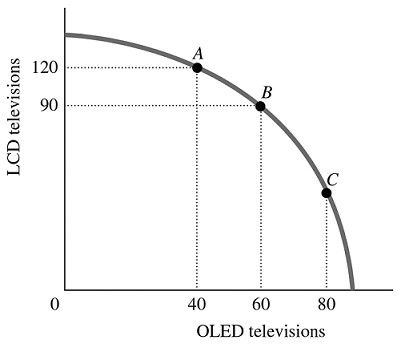 Figure 2.5Refer to Figure 2.5. The marginal rate of transformation in moving from Point B to Point A is
A. -2/3.
B. -3/4.
C. -1.5.
D. -20.
Answer: A
You might also like to view...
The implied growth rate for a country between 1960 and 2010 is 6%. This implies that:
A) the country needed to grow at an average rate of 6% per year between 1960 and 2010 to reach the 2010 level of GDP starting with the 1960 level. B) the country needed to grow by at least 6% in any of the fifty years between 1960 to 2010 to reach the level of GDP in 2010 starting with the 1960 level. C) the growth rate of GDP in the country was above 6% between 1960 to 1990 and above 6% between 1991 and 2010. D) the country needed to grow at rates above 6% per year between 1960 and 2010 to reach the 2010 level of GDP starting from the 1960 level.
Consider the market for peanut butter. If there is an increase in the price of peanuts,
A) there is a decrease in the supply of peanuts. B) there is a decrease in the demand for peanut butter. C) there is an upward movement along the supply curve for peanut butter. D) there is a decrease in the supply of peanut butter. E) the supply curve for peanuts shifts rightward.
The figure above shows the market for umbrellas in Sunville. Suppose the quantity of umbrellas currently traded in Sunville is 199 per day. If one more umbrella is sold, the total surplus in Sunville will
A) decrease by $26.67. B) increase by $26.67. C) increase by $50.00. D) not change.
The government of China has explicitly stated that the goal of its strict population control measures is to raise income per capita. What are the mechanisms at work in such a claimed relationship? Are there any counterarguments?
What will be an ideal response?