The pie chart below shows the number of pizzas consumed by college students in a typical month. Use the chart to answer the question. 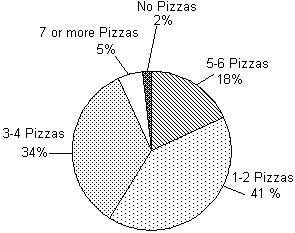 What percent of college students consume 4 pizzas or less in a typical month?
A. 75%
B. 77%
C. 43%
D. 82%
Answer: B
Mathematics
You might also like to view...
Find the potential function f for the field F.F =  i - 6j -
  k
k
A. f(x, y, z) =  - 6y + C
B. f(x, y, z) =  - 6y + C
C. f(x, y, z) =  - 6 + C
D. f(x, y, z) =  + C
+ C
Mathematics
The sequence is defined recursively. Write the first four terms.a1 = -1; an = 
A. a1 = -1, a2 = -  , a3 = -
  , a4 = -
B. a1 = -1, a2 = -  , a3 = -
  , a4 = -
C. a1 = -1, a2 = -1, a3 = -  , a4 = -
D. a1 = -1, a2 = -1, a3 = -  , a4 = -
Mathematics
Combine. Assume that all variables represent non-negative real numbers.14 + 10
+ 10
A. -4
B. 24
C. 24
D. 24
Mathematics
Find the volume.
A. 218 ft3
ft3
B. 20 ft3
ft3
C. 198 ft3
ft3
D. 72 ft3
ft3
Mathematics