Graph the inequality.y < -x - 2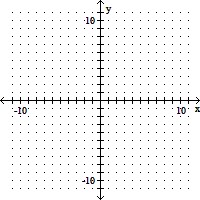
A. 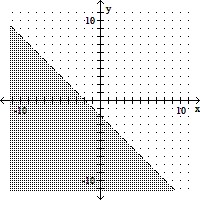
B. 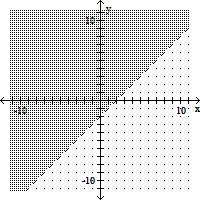
C. 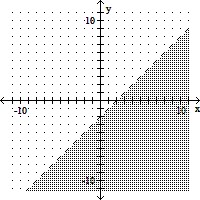
D. 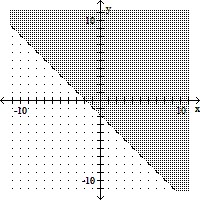
Answer: A
You might also like to view...
Graph the point.

A. 
B. 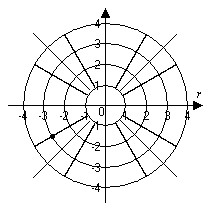
Find the x- and y-intercepts. If no x-intercepts exist, state so.y = -x2 - 2x - 13
A.  , (0, 13)
B. No x-intercepts, (0, -13)
C. No x-intercepts, (0, 13)
D.  , (0, -13)
Find the area of the shaded region. y = x4 - 32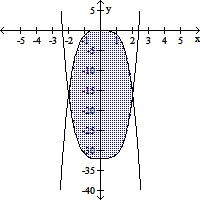 y = -x4
A. 
B. 
C. 
D. 
Find the equation that the given graph represents and give the domain, range, and interval(s) over which the function is increasing and decreasing.
A. P(x) = -x5 - 10x2 - 10; domain: (-?, ?); range: [-29.51, ?); Increasing over (-?, 0] and [4.77, ?); Decreasing over (-?, 0] and [0, 4.77] B. P(x) = x4 + x3 - 10x2 + 10; domain: (-?, ?); range: [-29.51, ?); Increasing over [-2.67, 0] and [1.90, ?); Decreasing over (-?, -2.67] and [0, 1.90] C. P(x) = x5 - 4x3 + 12x2 + 10; domain: (-?, ?); range: [-29.51, ?); Increasing over [-.61, ?); Decreasing over (-?, -.61] and [0, 7.85] D. P(x) = -x4 + x3 - 12x2 + 10; domain: (-?, ?); range: [-29.51, ?); Increasing over [-3.56, 0] and [.83, ?); Decreasing over (-?, -3.56] and [0, .83]