Using a graph, show the price-output combination of a natural monopoly without regulation and the price-output combination if the government requires the monopoly to earn a normal rate of return. What are economic profits in each situation?
What will be an ideal response?
In the above figure, the profit-maximizing price is Pm and the output is Qm. Profits are PmABC. Under rate-of-return regulation, price is equal to average total cost, H, and Qr is the output at this price. The firm earns zero economic profits.
You might also like to view...
In the figure above, at which point (a, b, or c) along the linear demand curve illustrated would demand be
a) most elastic? b) most inelastic?
Refer to the above figure. When the price in the market is $4, economic profits will equal
A) $100. B) $200. C) $300. D) $400.
The process of calculating revenue and expenses through receipts and other facts to determine what the numbers are for a company or entity is known as
a. finance b. budgeting c. economics d. accounting e. none of these
Refer to the information provided in Figure 2.4 below to answer the question(s) that follow.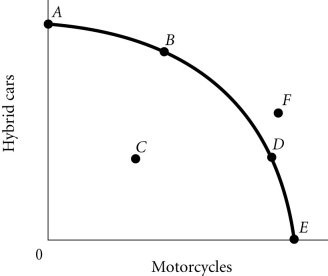 Figure 2.4Refer to Figure 2.4. The economy moves from Point A to Point D. This could be explained by
A. an increase in economic growth. B. a change in society's preferences for motorcycles versus hybrid cars. C. a reduction in unemployment. D. an improvement in technology.