Use a graphing calculator to plot the data and find the quadratic function of best fit.An engineer collects data showing the speed s of a given car model and its average miles per gallon M. Use a graphing calculator to plot the scatter diagram. What is the quadratic function of best fit?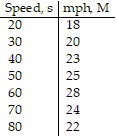
A. M(s) = -6.309x2 + 0.720x + 5.142
B. M(s) = -0.631x2 + 0.720x + 5.142
C. M(s) = -0.0063x2 + 0.720x + 5.142
D. M(s) = 0.063x2 + 0.720x + 5.142
Answer: C
You might also like to view...
Give a geometric description of the set of points whose coordinates satisfy the given conditions. x2 + y2 + z2 > 16
A. All points in space B. All points on the surface of the cylinder with radius 4 C. All points outside the cylinder with radius 4 D. All points outside the sphere of radius 4
Convert the angle into degree decimal form. Round the answer to two decimal places.275°33'32''
A. 275.52° B. 275.57° C. 275.56° D. 275.62°
Solve the quadratic equation.36k2 - 4 = 0
A.  , -
, - 
B. 3, 0
C. 2, 0
D. 3, - 3
Solve the problem.Use the floor plan shown to complete the exercise. On the plan, one inch (abbreviated in.) represents four feet. What is the length and width of bedroom 1?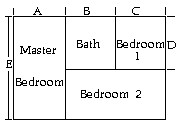 A = 3.8 in.D = 2.2 in.B = 1.7 in. E = 5.4 in.C = 3.2 in.
A. 45.6 in., 38.4 in. B. 12.8 ft, 8.8 ft C. 15.2 ft, 8.8 ft D. 38.4 in., 26.4 in.