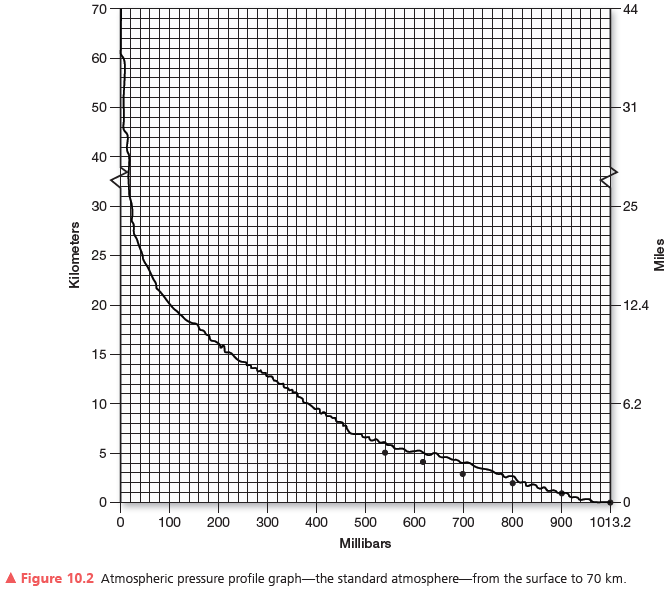
Using the graph in Figure 10.2, plot the standard atmosphere of air pressure decrease with altitude presented in Table 10.2. After completing the plot, connect the data points with a line to complete the pressure profile of the atmosphere. The data points from 0 to 5 km are plotted for you.
What will be an ideal response?
Environmental & Atmospheric Sciences
You might also like to view...
Silverfish insects travel with army ants to share the food the ants leave behind after eating. This is an example of ____.
A. mutualism B. commensalism C. succession D. parasitism E. specism
Environmental & Atmospheric Sciences
The largest marine animals, such as the baleen whales, eat: a. secondary consumers, such as krill
b. small fish. c. primary consumers, such as copepods. d. top consumers, such as seals and large fish.
Environmental & Atmospheric Sciences
Differentiate between tornado families and tornado outbreaks
Environmental & Atmospheric Sciences
The conservation ethic suggests that ___________.
Fill in the blank(s) with the appropriate word(s).
Environmental & Atmospheric Sciences