The following figure shows the production-possibility curves for Canada (AB) and the rest of the world (CD). Suppose Canada begins to trade with the rest of the world. If, in the international market, one bushel of corn is exchanged for one liter of maple syrup, Canada will produce ________ bushels of corn and the rest of the world will produce ________ liters of maple syrup.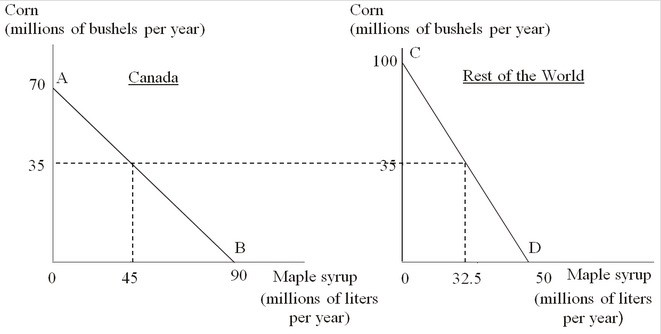
A. 90; 100
B. 70; 50
C. 35; 32.5
D. 0; 0
Answer: D
You might also like to view...
Starting from long-run equilibrium, a large tax increase will result in a(n) ________ gap in the short-run and ________ inflation and ________ output in the long-run.
A. recessionary; lower; potential B. expansionary; lower; potential C. expansionary; higher; potential D. recessionary; lower; lower
Which of the following helped transform the budget deficits of the early 1990s into surpluses later in the decade?
a. Rapid growth in the number of persons moving into the retirement phase of life during the 1990s b. A reduction in defense expenditures following the end of the Cold War c. A 1997 increase in the tax rate imposed on income derived from capital gains d. A reduction in Social Security and health-care benefits during the 1990s
The money demand curve shifts to the left when the Fed buys government bonds
a. True b. False Indicate whether the statement is true or false
The expected rate of inflation is built into current nominal rates of interest.
a. true b. false