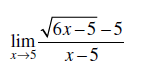
Find the following limit using tables on a grapher. Start with Step = 0.1 and then go to 0.01, 0.001, and 0.0001. When you think you know the limit, graph and use the TRACE feature to further verify your assertion.
3/5
You might also like to view...
______ float represents the value of checks that have been written and disbursed but have not been deducted from the account on which they were written.
A. Disbursement B. Net C. Collections D. Payables E. Deposit
Complete the horizontal analysis for the balance sheet. Round to the nearest tenth of a percent.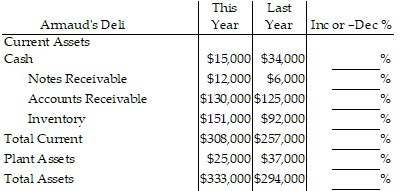
A. 226.7%, 50.0%, 96.2%, 60.9%, 83.4%, 148.0%, 88.3% B. -126.7%, 50.0%, 3.8%, 39.1%, 16.6%, -48.0%, 11.7% C. -55.8%, 99.8%, 4.0%, 64.1%, 19.8%, -32.4%, 13.2% D. -55.9%, 100.0%, 4.0%, 64.1%, 19.8%, -32.4%, 13.3%
Solve the problem.The number of cases of a certain strain of influenza in the world are shown in the table for various years.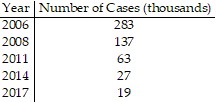 Let f(t) be the number of cases (in thousands) in the year that is t years from 2003. The equation is
 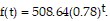 Predict when there will be 2 thousand cases.
A. 2026 B. 2028 C. 2025 D. 2027
Graph the linear function.P(x) =  x - 2
x - 2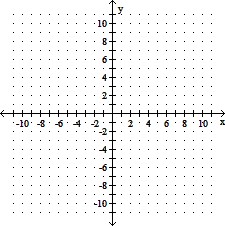
A. 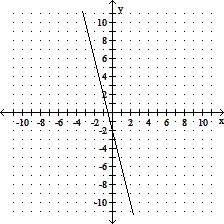
B. 
C. 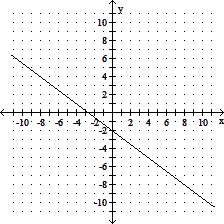
D. 