Solve the problem.The following table shows the sales generated by electronic commerce, in millions of dollars in Country X from 1993 through 1997 . Use regression to find a quadratic function f(x) that can be used to predict the sales generated by electronic commerce x years after 1993. (Round decimals to four places.)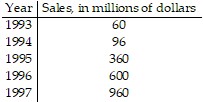
A. f(x) = 52.1143x2 + 44.5714x + 43.5429
B. f(x) = 44.5714x2 + 52.1143x + 43.5429
C. f(x) =43.5429x2 + 52.1143x + 44.5714
D. f(x) = 44.5714x2 - 52.1143x + 43.5429
Answer: B
You might also like to view...
Find the center of mass of a thin plate covering the given region with the given density function.The region bounded by the parabola y = 81 - x2 and the x-axis, with density ?(x) = 9x2
A.  = 0,
= 0,  =
= 
B.  = 0,
= 0,  =
= 
C.  = 0,
= 0,  =
= 
D.  =
=  ,
,  = 0
= 0
For the equation, create a table, -3 ? x ? 3, and list points on the graph.y = x + 4
A. 
(-3, 7), (-2, 6), (-1, 5), (0, 4), (1, 3), (2, 2),
(3, 1)
B. 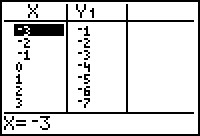
(-3, -1), (-2, -2), (-1, -3), (0, -4), (1, -5),
(2, -6), (3, -7)
C. 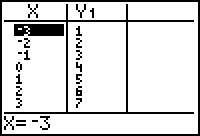
(-3, 1), (-2, 2), (-1, 3), (0, 4), (1, 5),
(2, 6), (3, 7)
D. 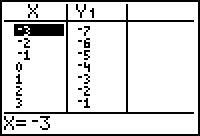
(-3, -7), (-2, -6), (-1, -5), (0, -4), (1, -3),
(2, -2), (3, -1)
Decide whether the points in the table lie on a line. If they do, find the slope-intercept form of the line.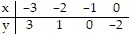
A. Yes; y = -2x + 3 B. No C. Yes; y = 3x D. Yes; y = -3x + 3
Graph the piecewise linear function.f(x) = 

A. 
B. 
C. 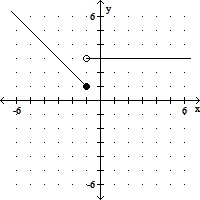
D. 