Select the correct graph of the function.
?

?
A. 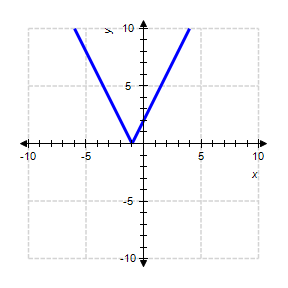
B. ?
C. ?
D. ?
E. ?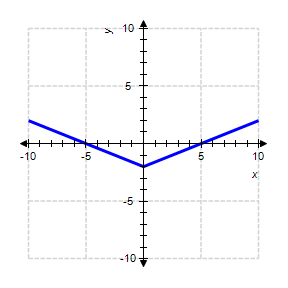
Answer: B
You might also like to view...
Solve the problem.The table shows the number of new cases (in thousands) of a certain disease diagnosed in a country in various years.  Let f(t) be the number of new cases (in thousands) of the disease diagnosed at t years since 2010. Use a quadratic model to predict when the number of new cases of the disease diagnosed will be 53,700. (First find a quadratic equation for f in vertex form by using the data for the years 2013 and 2017).
A. 2021 B. 2019 C. 2020 D. 2022
Use the shell method to find the volume of the solid generated by revolving the shaded region about the indicated axis.About the y-axis

A. 9? B. 6? C. 3? D. 12?
Factor the expression completely.A circular pool is surrounded by a concrete walk. The area of the concrete around the pool is 
A. ?(R - r)2 B. ?(R2 - r2) C. (?R + ?r)(R - r) D. ?(R + r)(R - r)
Find the sum.-56 + 73
A. 17 B. -17 C. -129 D. 129