Use the frequency distribution to find the mean and the sample standard deviation. Does the data form a normal distribution? Remember: if the data fall within 2% of the empirical rule of 68%, 95%, and 99.7% for one, two, or three standard deviations, respectively, they form a normal distribution.
Interval Midpointx Frequency f42.5 - 50.5 950.5 - 58.5 4558.5 - 66.5 20566.5 - 74.5 19074.5 - 82.5 4482.5 - 90.5 20
A. The mean is 62. The sample standard deviation is 9.2. The data doesn't form a normal distribution.
B. The mean is 60. The sample standard deviation is 6.2. The data doesn't form a normal distribution.
C. The mean is 60. The sample standard deviation is 6.2. The data forms a normal distribution.
D. The mean is 67. The sample standard deviation is 7.7. The data doesn't form a normal distribution.
E. The mean is 67. The sample standard deviation is 7.7. The data forms a normal distribution.
Answer: D
You might also like to view...
Find the average value of  over the given region.
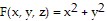 + z2 over the cube in the first octant bounded by the coordinate planes and the planes
  ,
,  ,
, 
A. 162 B. 81 C. 9 D. 243
Find the missing angle or angles.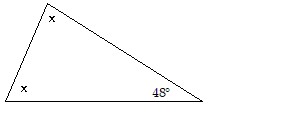
A. 66°, 66° B. 33°, 33° C. 48°, 84° D. 156°, 156°
Round the whole number to the given place value.1402 to the nearest thousand
A. 900 B. 1000 C. 2000 D. 1100
Write the spreadsheet expression in ordinary algebraic notation. Let cell A1 represent the variable x.
?
What will be an ideal response?