The line graph shows the recorded hourly temperatures in degrees Fahrenheit at an airport. 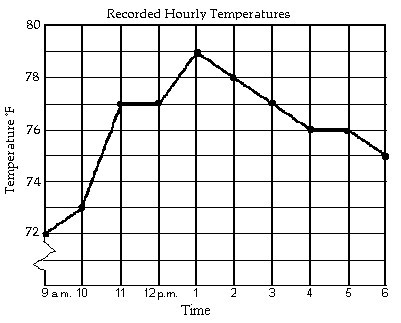 During which hour did the temperature increase the most?
A. 10 a.m. to 11 a.m.
B. 12 p.m. to 1 p.m.
C. 9 a.m. to 10 a.m.
D. 1 p.m. to 2 p.m.
Answer: A
Mathematics
You might also like to view...
Graph the linear equation in two variables.y = 3x + 6
A. 
B. 
C. 
D. 
Mathematics
Evaluate the expression.P(8, 3)
A. 336 B. 168 C. 6720 D. 240
Mathematics
Use completing the square to rewrite the equation in one of the standard forms for a conic and identify the conic.x2 + y2 + 10x - 4y + 18 = 0
A.  -
-  = 1; hyperbola
B. (x + 5)2 + (y - 2)2 = 11; circle
C.  +
+  = 1; ellipse
D. (x - 5)2 + (y + 2)2 =  ; circle
Mathematics
Evaluate the expression x + y for the given values of the variables.x = -32, y = 0
A. 0 B. -320 C. 32 D. -32
Mathematics