In this figure, the shaded areas represent ______.
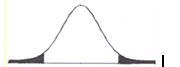
a. values of the statistic with a low probability of occurring
b. the region of non-rejection
c. the symmetry of the distribution
d. 95% of the distribution
a. values of the statistic with a low probability of occurring
You might also like to view...
List three of the required components of the Individualized Family Support Plan (IFSP) as required in IDEA 2004
What will be an ideal response?
Why does the moon appear to go through phases?
a......................................................................One side of the moon never gets sunlight. b.......................................................We see varying portions of the moon's lighted side. c...............................................................Part of the moon is in the shadow of the earth. d..................................................The moon changes shape as it moves along in its orbit.
Where can published transition knowledge and competencies be found?
a. local school districts b. Taxonomy for Transition Programming c. Council for Educational Assessment d. U.S. Congress
The point of the authors' attention to Collier's film censorship was that it illustrated
A. Collier's paternalism. B. Collier's respect for the power of art and culture as social tools. C. Collier's zeal for values education. D. All these answers are correct.