Interpret the table below.
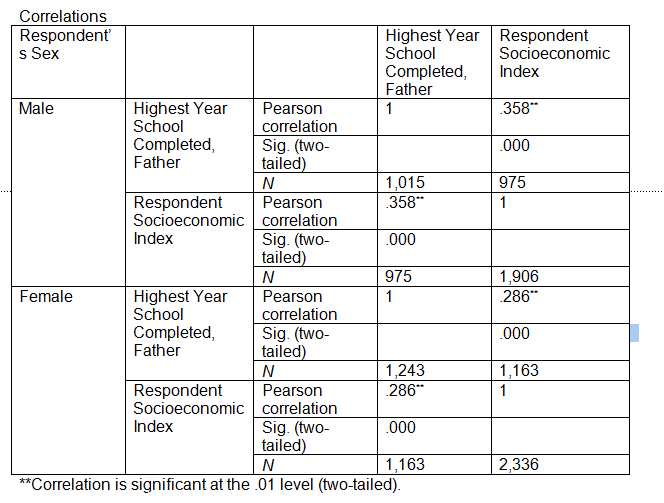
As the scatterplot indicates, the association between father’s education and respondent’s socioeconomic status is positive for both males and females. However, you can see that the lines cross somewhere around 10 years of father’s education. This indicates that while both males and females benefit from their father’s education, males tend to benefit at a greater rate, as indicated by the steeper slope of the fit line. We can also see in the correlation table above that for males the Pearson’s r is equal to .358. On the other hand, for females the Pearson’s r is .286. This indicates that the association of father’s education with respondent’s socioeconomic status is stronger for males than it is for females.
You might also like to view...
Which of the following is considered significant federal legislation because it prohibits medically unnecessary placement of a disabled person in an institution?
A. ADA B. Olmstead decision C. Zebley decision D. IDEA
According to postmodern thinking, mental illness is a
a) discourse b) binary category c) deconstructed category d) subjugated category
In the 1980s the women's liberation movement was widely blamed for depriving women of their femininity, their traditional rights to custody and alimony, and their special protections from hazardous work, but credited for helping to pass the family leave program.
Answer the following statement true (T) or false (F)
Which of the following is usually a weakness for microgenetic designs?
a. They often have small sample sizes. b. They often rely too heavily on genetic explanations. c. They often rely on reductionist explanations. d. They often have large amounts of qualitative data without high reliability.