Is it possible for the average fixed cost curve to have the shape depicted above? Explain
What will be an ideal response?
Average fixed costs are equal to the total fixed costs divided by output. Mathematically speaking this figure will continue to fall since the number in the numerator remains fixed while the number in the numerator rises. Therefore, it isn't possible for the average fixed cost curve to have the shape that is depicted in this graph
You might also like to view...
The above figure illustrates that if this country wishes to move from its current production point (labeled "Current") and have 10 more tons of food, it can do this by producing
A) 10 more tons of clothing. B) 10 fewer tons of clothing. C) 5 more tons of clothing. D) 5 fewer tons of clothing.
Summarize the effects of a subsidy on the market price and the quantity produced
What will be an ideal response?
What distinguishes short-run cost analysis from long-run cost analysis for a profit-maximizing firm in the short run?
a. The size of the factory is fixed. b. There are no fixed costs. c. Output is not variable. d. The number of workers used to produce the firm's product is fixed.
Figure 3-18
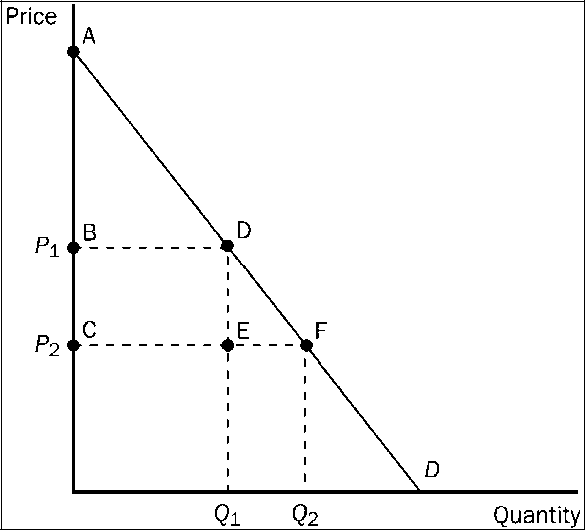
Refer to . Which area represents the increase in consumer surplus when the price falls from P1 to P2?
a.
ABD
b.
ACF
c.
DEF
d.
BCFD