The graph below shows estimated world population for the period 4000 BC - 2000 AD. Note that the logarithm of the world population and not actual population is plotted on the vertical axis. This means, for example, that when the graph reaches 7 on the vertical scale, world population is 107 and when the graph reaches 9 on the vertical scale, world population is 109. Log World Population  ? Year Use the graph to answer the question.Describe the general trend in world population during the period 2000 BC to the year 1 AD.
A. World population increases at a constant rate.
B. World population is constant.
C. World population increases at a faster and faster rate.
D. World population increases at a slower and slower rate.
Answer: C
Mathematics
You might also like to view...
The graphing calculator screens show a system and the point of intersection. Choose the screen which best represents the given system.2x - y = 03x + y = 0
A. 
B. 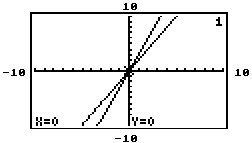
C. 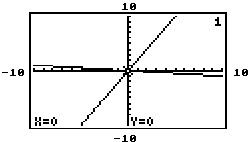
D. 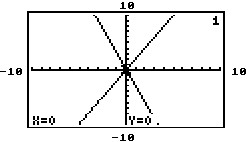
Mathematics
Solve the problem.
 Determine the coupon rate of a bond issued by Bank.
A. 4.950% B. 4.800% C. 5.050% D. 4.650%
Mathematics
Find the unit vector in the same direction as the given vector.v = 4i + 3j
A. u =  i +
i +  j
j
B. u = -  i -
i -  j
j
C. u =  i +
i +  j
j
D. u = 20i + 15j
Mathematics
Determine whether the following is an expression or an equation.8x = 15
A. Expression
B.
| Equation |
Mathematics