In the graph below, the price of capital is $500 per unit. When output is 10,000 units, what is long-run average cost?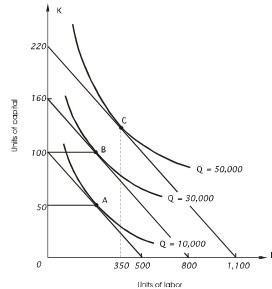
A. $5
B. $500
C. $20
D. $0.20
E. none of the above
Answer: A
You might also like to view...
A(n) ________ is a sharp increase in asset prices brought about by unrealistic expectations about further price growth.
A. speculative bubble B. austerity measure C. financial crisis D. economic stimulus
The price elasticity of supply measures how
A. responsive quantity supplied is to a change in incomes. B. easily labor and capital can be substituted for one another in the production process. C. responsive the quantity supplied of Y is to changes in the price of X. D. responsive the quantity supplied of X is to changes in the price of X.
Which of the following accurately describes the relationship between excess reserves and checkable deposits following the financial crisis of 2007-2009?
A) Excess reserves declined as the excess reserve ratio returned to near zero. B) Excess reserves rose to nearly one-third of checkable deposits. C) Excess reserves approached the same level as checkable deposits. D) Excess reserves exceeded checkable deposits.
The difference between the value of goods exported and imported is the:
A. financial and capital account balance. B. current account balance. C. government financial balance. D. balance of merchandise trade.